Posts Tagged ‘Storage’
EMC FAST-cache and “Follow the I/O”
I do not often write to specific implementations of a vendor. This time however I focus on EMC’s FAST-cache technology, and we will be playing a little “follow the I/O” to see what it actually does, where it helps and where it might not.
Different Routes to the same Storage Challenge
Once shared storage came about, people have been designing these storages so that you would not have to care again for failing disks; shared storage is built to cope with this. Shared storage is also able to deliver more performance; by leveraging multiple hard disks storage arrays managed to deliver a lot of storage performance. Right until the SSDs came around, the main and only way of storing data was using hard disks. These hard disks have their own set of “issues”, and it is really funny to see how different vendors choose different roads to solve the same problem.
“If only we could still get 36GB disks for speed”
Yesterday I remembered a rather funny discussion I once had. Someone stated “if only we could still get 36GB 15K disks, we could speed things up by using a lot of spindles”.
Kind of a funny thing if you think about it. At the time I figured that 36GB disks would force you to use more drives in order to reach a proper capacity. And since a lot of people still tend to scale to capacity only, your problems increase with the size of disks. Let’s say your environment requires 6TB, you could use 4 2TB drives in RAID5 – But don’t expect 100 VMs running properly from that 😉
The funny thing (and the reason for this post) is that most people seem to miss out on the following…
The latest thing: vTesting!
Yes I admit it, now that I’m an EMC vSpecialist I do not have very much time left for all these deepdive measurements. So I’m forced to introduce a new type of testing. I’ll call it a vTest. Actually Einstein is the father of this type of testing, simply because he did not have spaceships that could do near-lightspeed. Me, I simply lack time. Hm that is a kind of deep statement in this light right 🙂
With no further delay I’ll just drop the statement for this vTest, and we’ll boldly go where no geek has gone before:
So how many of you think the above is pure nonsense? Don’t be shy, let’s see those fingers!
Now for the actual vTest: In this test I play the devil’s advocate and use a 2TB 7200rpm SATA drive, and a 36GB 15K FC disk. Both disks get 36GB of data carved out. Now we run a vTest performing heavy random access on both 36GB chunks.
See where I’m going? If not, here is a hint: Throughput part 1: The Basics. In random access patterns, the biggest latency in physical disks comes from the average seek time of the head to the correct cylinder on disk. And the trick is in the “average” part.
The average seek time is the average time required for a head to seek to any given cylinder on the disk. But this seek time heavily depends on where the head was coming from. Normally the average seek time is measured when the head needs to travel half of the platter’s surface. But in our test that is far from reality for our 2TB SATA drive!
As the 36GB 15K FC drive has to move its head all over the platter, the 2TB SATA disk only moves (36GB/20000GB)*100 = 1,8% of its total stroke distance. In fact even that is a lie: The outside of the platter carries way more data than the inside, so assuming the 36GB is carved out at the edge (what most arrays do), this number is even lower, probably below 1% !
This means the average seek time of this disk is no longer around 8-9ms, but drops to around 1ms (no, not 1% of 9ms! This value will be very near the track-to-track seektime which for SATA usually is around 1ms). Even the addition of the extra rotational latency of the SATA disk (because it spins at 7200rpm instead of 15000rpm) does not help: The total average seek time is still way lower than the total average seek time of the poor 36GB 15K disk…
Yes you could discuss on caching efficiency; the way the disks differ in sorting the order in which they fetch random blocks, but still:
(At least it should get you thinking!)
Chad’s World debut!
For those of you (like me 🙂 ) who are dying to see… The first episode of Chad’s World is online! Check it out here: Chad’s World
Presenting at the Dutch VMUG 2010!
This year the dutch VMUG event (see www.vmug.nl) is surely going to be a great success. Again! For the first time I’ll be there as a blogger. Even better, last week I had a nice discussion with someone at IBM. They welcomed me to deliver 20-30 minutes of their presentation at the VMUG2010 event!
So be sure to visit the VMUG 2010 event, and especially the 15:50 – 16:50 session “Van Virtualisatie tot Cloud Computing: portfolio en praktijk” because I’ll be presenting there, and it is going to be really interesting too! Read the rest of this entry »
Throughput part 4: A day at the races (Hotspotting case)
The fourth part of this triptych ( 😉 ) is a customer case of hotspotting on storage. The graphs speak for themselves! Some storage design decisions they made caused them a lot of trouble…
Birth of the storage design
The customer in question was going to run a large VDI (virtual desktop) deployment in several pods. The first pod was designed with two low-cost FC SANs, each having 48 SATA disks. A single SAN should deliver full-clone desktops for 500 users. Running on a “conventional” FC-SAN (no ZFS filesystem or large caches) 48 SATA disks for 500 vDesktops alone is what I’d call a challenge already!
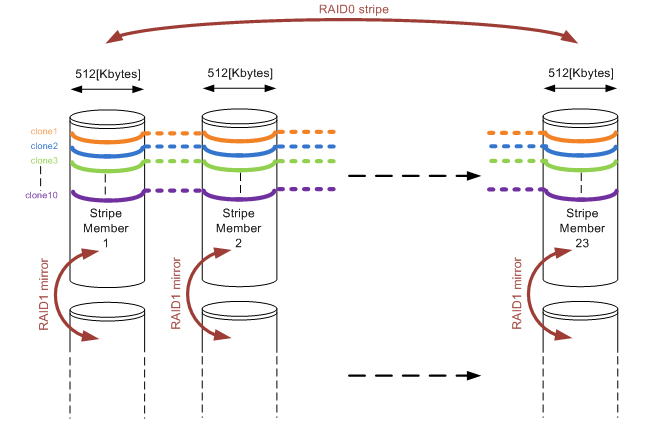
Apart from that they started out right, by choosing a RAID10 configuration. They reserved two SATA disks to function as a hot-spare. So far so good. But then what? You have 46 disks left, and you must put them in a RAID10. They decided so create ONE single RAID10 volume, consisting of 46 disks, thinking that for each I/O performed all disks would be used, boosting performance. On top of that, they decided to use 512KByte as a segment size, because VMware uses a blocksize of at least 1Mbyte anyway (both not true of course). The setup on a disk-level looks something like this:

Figure1: RAID10 array consisting of 23 stripe members and showing 10 full-cloned vDesktops layed out on the disks.
For those of you who have read the other parts of my throughput blogs, might already have spotted where things go wrong. In fact things went horribly wrong as I’ll demonstrate in the following section.
What’s happening here?
As described in Throughput part 1: the basics and Throughput part2: RAID types and segment sizes, in a random I/O environment you optimally want only one member of a stripe to perform a seek over a single I/O. That is covered when using 512KB segments. During a complete random I/O pattern, things really aren’t that bad: the randomness makes sure all mirror pairs will be active, no matter how big the segment size might be. The large number of members does not impact rebuild times as well in a RAID10 configuration.
The very large amount of stripe members (23 mirror pairs) in combination with the rather large segment sizes is what really caused the fall though. As soon as the environment was running a larger number of vDesktops, and new vDesktops were cloned, things got bad fast. Full cloning technology was used, which means that each vDesktop has a full image on disk (about 16Gbytes in size). The VDI solution used, was only able to limit the deployment of vDesktops to a number per ESX host. To make a short story even shorter, during a deployment they ran 10 full-cloning actions in parallel against a single SAN. Watch and be amazed what happened!
A day at the races
So why is this blog called “a day at the races” anyway? Well, it simply reminded me of horse racing (and Queen rocks 😉 ). Time for some theory before we prove it also applies in real life. Let’s assume we already have vDesktops already running (let’s say about 250 of them; the number is not really relevant here). They perform random I/O’s on the SAN, loading all disks to some degree (performance wise).
Now we start a single cloning thread (the VDI broker calls for a cloning action to VMware). Sequential reads and writes start to occur (from the template into the new vDesktop virtual disks). Assuming this clone runs at just about 60[MB/sec] (which is a realistic yet theoretical number), and the segment size is 0,5Mbytes over 23 stripe members, each stripe member is accessed about 60 / 0,5 = 120 times every second. No bells ringing yet…
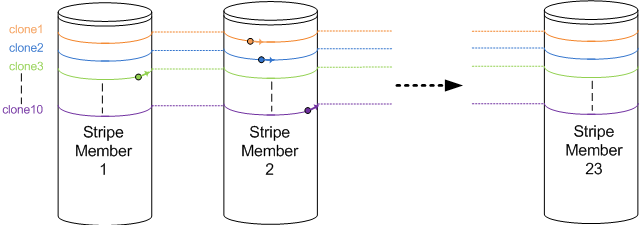
Now think about not one clone, but 10 of these full cloning actions running simultaneously. Remember each cloning action accesses only one stripe member at a time (as they progress through all of the stripe members over and over again). Basically all cloning actions race each other over the stripe members, each a few full-stripes below the other (see figure 1). Assuming they never run at exactly the same speed, it is to be expected two full clones will meet on the same stripe member, slowing things down for these two full clone actions, sticking them to that single stripe member for the time.
As soon as they slow down, the other cloning actions which still run faster “crash” into the rear of this stripe member as well. In the end, all full cloning actions are hammering on the same stripe member, while all other disks are not being accessed by the cloning action at all. Hopefully you’l get the idea when looking at figure 2:

Figure 2: Ten cloning actions racing each other. All are writing on the impacted Stripe Member 2. Clone10 (purple) is about to escape, while clone3 (green) is about to crash into the rear of the impacted Stripe member again.
Each cloning action runs along one of the coloured lines, visiting all stripe members over and over again. Multiple writes being performed to a single stripe member will cause all those writes to slow down (the stripe member gets busier). This in turn causes the other sequential writes which did not slow down yet to “crash into the rear” of the impacted stripe member, causing an even bigger impact. This finally results in all cloning actions hammering on the same single stripe member, forcing the entire SAN to its knees.
As soon as one full clone “escapes the group”, it finds the other stripe members which do not suffer from the hammering. So they pick up speed, race through the non-impacted stripe members, and simply crash into the rear of the stripe member where they just managed to escape from again. Basically, the system will keep hammering on a single stripe member!
In the end, the 10 parallel full cloning actions effectively use one single stripe member, giving the performance of one single SATA disk (RAID 1 write penalty is 2, meaning a stripe member (=mirror pair of disks) perform like a single SATA disk for writes). The overall cloning performance was measured, and went down to about 5 [MB/sec] effectively. Running vDesktops came to a near-freeze.
When you calculate the frequency in which the stripe members are “visited” now, you’ll find that each stripe member is accessed about 5 / 0,5 = 10 times every second. This is a frequency of 10[Hz], very visible to the human eye! So you could actually see this happening on the array (10 times a second the disk activity leds will swipe across the array). Too bad I don’t have a video on that one 🙁
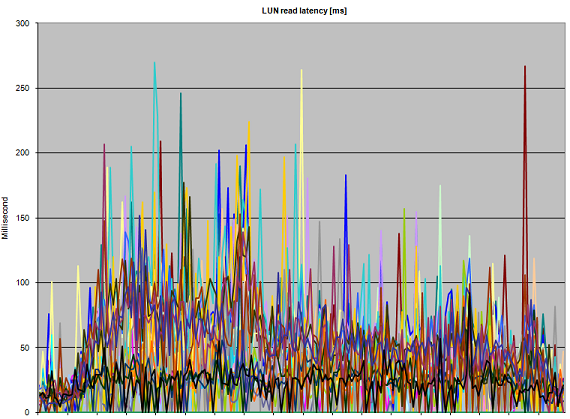
Here some latency graphs on the array during the parallel deployment of 10 full clones:

Figure 3: Abnormal read Latency during 10 parallel full-clone actions
Figure 3 clearly shows that performance suffers. Even though the heavy writes are are thought to be the guilty ones, all reads that have to be performed on the impacted stripe member suffer as well, kicking up read latency well over 150 [ms]. The reason the graph keeps touching the lower parts of the graph (which are low-latency reads) are probably the effect of read cache (when disks are not required to service a read request).

Figure 4: Abnormal write Latency during 10 parallel full-clone actions
Write latency in figure 4 is really showing the infamous “A bridge too far”. Especially in the left side of the graph, latencies run up dramatically. The LUNs that draw a thin line along the 10[ms] boundary do not appear to be impacted as much as the other LUNs; this is probably due to the fact that these LUNs are not being written to by a full clone action, so therefore only the random writes performed by the already running vDesktops are registered there. Nonetheless they also see the impact of the cloning (note the starting situation where all write latencies are well below 3 [ms] ).
All other vDesktops running are still performing their random I/O. As long as they do not hit the “impacted stripe member” they just go about their business. But as soon as they hit that stripe member (and they will), they start crawling. In effect, the entire SAN performance appears to crumble, and the vDesktops freeze almost completely.
How to fix things
So how do you fix these issues? The answer is relatively simple: The customer upgraded their disks to 15K SAS drives (being a more realistic configuration for running 500 vDesktops), and they divided the available disks in 4 separate RAID10 groups instead of just one. Also, they decreased the segment size to 64KBytes, which appears a much more sane design.
The smaller segment size will cause cloning actions to stick to a particular segment for a much shorter period of time. More disk volumes with smaller number of members in the stripe will help to isolate performance impact. Together with faster disks performance was boosted effectively (a 15K SAS drive delivers about three times the amount of IOPS a single 7K2 SATA disk can handle).
Throughput part 1: The Basics
As I tackle more and more disk performance related issues, I thought it was time to create a series of blogposts about spindles, seektimes, latency and all that stuff. For now part 1, which covers the basics. Things like raid type, rotational speeds and seektimes basically make up “how fast you will go”. On to the dirty details!
Introduction to physical disks and their behaviour
So what is really important when looking at physical disks, and their performance? Firstly and most important, we must look at the storage system parameters in order to reduce disk latencies. In order to be able to do this properly, we have to take into account the characteristics of the I/O what is being performed. Secondly, we have to look at segment sizes within the chosen raid types (which in turn followes from the system parameters). Finally, we’ll deepdive into alignment (which still appears to be misunderstood by a lot of people)
Read the rest of this entry »


 LinkedIn
 Twitter