Posts Tagged ‘vscsistats’
Sizing VDI: Steady-state workload or Monday Morning Login Storm?
For quite some time now we have been sizing VDI workloads by measuring what people are doing during the day on their virtual desktops. Or even worse, we use a synthetic workload generator. This approach WILL work to size the storage during the day, but what about the login storm in the morning? If this spikes the I/O load above the steady stte workload of the day, we should consider to size for the login storm…
Why Virtual Desktop Memory Matters
I have seen several Virtual Desktop projects with “bad storage performance”. Sometimes because the storage impact simply was not considered, but in some cases because the project manager decided that his Windows 7 laptop worked ok with 1GB of memory, so the Virtual desktops should have no issue using 1GB as well. Right? Or wrong? I decided to put this to the test.
Test setup
To verify the way a windows 7 linked clone (VMware View 5) would perform on disk, I resurrected some old script I had laying around on vscsiStats. Read the rest of this entry »
vscsiStats 3D surface graph part 3: Build your own!
Some people have asked me how to actually create the 3D graphs from the vcsiStats tool. I use a simple Excel sheet for this. Using the script I described in vscsiStats into the third dimension: Surface charts! , you can import the files outputted into excel and see the Excel chart instantaneously.
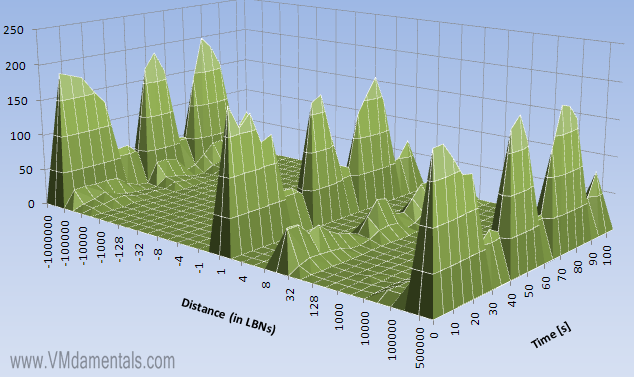
The vscsiStats tool is a very powerfull vSphere utility. It allows you to see virtual disk performance (such as latency, IOPS block sizes etc). The script I used in part 1 and in part 2 of this series will shoot multiple samples of these values right after each other, which you can then import into Excel to produce surface charts, like this one:

How to create graphs like this is described in detail below. Read the rest of this entry »
vscsiStats in 3D part 2: VMs fighting over IOPS
vscsiStats is definitely a cool tool. Now that the 2D barrier was broken in vscsiStats into the third dimension: Surface charts! it is time to move on to the next level: Multiple VMs fighting for IOPS!
Update: Build your own 3D graphs! Check out vscsiStats 3D surface graph part 3: Build your own!
I figured the vscsiStats would be most interesting in a use case where two VMs are battling for IOPS from the same RAID set. A single VM would have to force I/O on a RAID set. Wouldn’t it be cool to start a second VM on the same RAID set later on and to see what happens in the 3D world? In this blogpost I’m going to do just that!
TO THE LAB!
The setup is simple: Take a LUN on a RAID5 array of (4+1) SATA72K spindles, take two (Windows 2003 server) VMs which have a datadisk on this LUN. Now install iometer on both VMs. These two instances of iometer will be used to make both VMs fight for IOPS.
The iometer load is varied between measurements, but globally it emulates a server load (random 4K reads, random 4K writes, some sequential 64K reads).
First only a single VM runs the iometer load. At 1/3rd of the sample-run, the second VM is started to produce the same IO pattern. At 2/3rd, the first VM stops its IO pattern load. This results in the following graph:
vscsiStats into the third dimension: Surface charts!
How could I ever have missed it… vscsiStats. A great tool within vSphere which enables you to see VM disk statistics. And not only latency and number of IOPs… But actually very cool stuff like blocksizes, seekdistances and so on! This information in not to be found in esxtop or vCenter performance graphs… So we have to rely on once more on the console…
UPDATE: Available now: vscsiStats in 3D part 2: VMs fighting over IOPS !
UPDATE2: Build your own 3D graphs! Check out vscsiStats 3D surface graph part 3: Build your own! Read the rest of this entry »


 LinkedIn
 Twitter